|
The Pääkaupunkiseutu (PKS or metropolitan area) in Finland covers Helsinki, Espoo, Vantaa and Kauniainen, and its roads have some of the highest traffic densities in the country. The Tiehallinto (Finnish Road Administration, Finnra) has installed a journey-time monitoring system (JTMS) on some of the principal routes in this area to provide real-time information about traffic flow within it. A pilot scheme was installed in 1998 using three sites along a 15 km stretch of the Kehä (Ring Road) Ⅰ which runs around Helsinki, and this system was expanded to provide more detailed coverage of the Kehä Ⅰ, and also to monitor flow along two of the principal arterial roads (Vt1 and Vt4) in and out of the city, and between these roads and the Kehä Ⅰ. NCTR has supplied all the instation and outstation software for this system.
The JTMS measures the journey times of vehicles travelling in both directions along each monitored route using automatic number plate readers (ANPRs) to time individual vehicles along those routes. The information from the ANPRs is sent at regular intervals to the Tiehallinto’s Uusimaa Region Traffic Management Centre in Helsinki, where the vehicle journey times are calculated and presented, together with other diagnostic information, to the Tiehallinto’s operators and other authorised users.
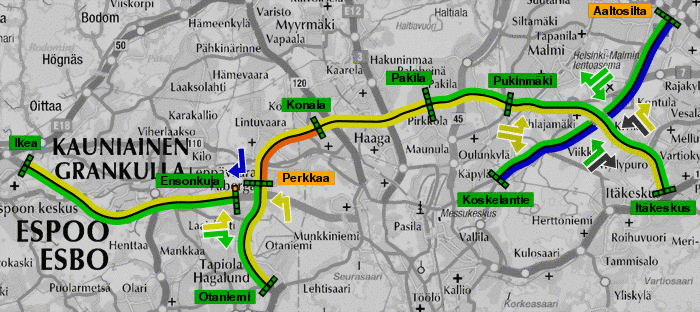
The information is presented through a web-based user interface, which shows the individual routes and also the operating status of each monitoring point. This is a snapshot of the operators’ map, showing typical Friday afternoon congestion.
|
|
The Kehä Ⅰ runs from Otaniemi in the south west round through Perkkaa and Konala to Pukinmäki and Itäkeskus in the east. The monitored section of the Vt1 is on the western side of the Kehä Ⅰ, and the monitored section of the Vt4 runs north eastwards from the Kehä Ⅰ. About 100 km further north along the Vt4 is another section along which traffic flow is monitored, by the Vt4 JTIS.
The monitored routes are colour coded according to the level of congestion on them; the ‘free-flow’ characteristics of each route are set individually, and then the route’s colour thresholds are derived from its own ‘free-flow’ characteristics. The above snapshot was taken near the height of the Friday afternoon congestion at about 16:45, and it is clear that much of the Kehä Ⅰ is moving slowly (yellow), in particular the section from Perkkaa to Konala, shown in orange. Traffic leaving the city along Vt1 (yellow from Ensonkuja to Ikea) and along Vt4 (blue from Koskelantie to Aaltosilta) is also congested. On the ‘turning routes’ (shown by the coloured arrows near the intersections) traffic is also moving slowly from the Kehä Ⅰ on to the Vt1 and Vt4 in the outbound directions.
The operators obtain this information through any standard Web browser. By clicking on any of the coloured routes, they can see more detailed information about that route, including a graph of individual vehicle journey times, such as this example for the route between Perkkaa and Konala (shown in orange on the map above).
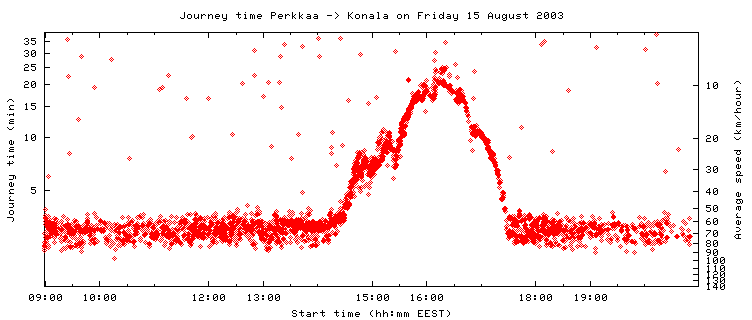
This graph shows journey times clockwise around a 3.3 km section of the Kehä Ⅰ between Perkkaa and Konala over a twelve-hour period. Each point represents an individual vehicle seen at the upstream (Perkkaa) and downstream (Konala) monitoring points. Its measured journey time is plotted against the time at which the journey started (when the vehicle passed Perkkaa). The timecourse of the afternoon congestion, from about 14:00 to 17:30, is very clear. When this congestion is at its worst, the journey from Perkkaa to Konala takes about ten times longer (25 minutes) than when traffic is flowing smoothly (two to three minutes). This plot also shows that as congestion increases, the variation in journey times between vehicles decreases, reflecting the fact that as vehicles become more closely packed they have less freedom to travel at different speeds.
As well as journey-time information, the operators’ map shown above also provides information about the operating status of the outstation equipment. The outstation labels are colour coded. Most are green, indicating that there are no problems, but the sites at Aaltosilta and Perkkaa are orange, warning of non-fatal error conditions at these sites. In this case, there was an abnormally high frequency of reboots at Aaltosilta, because of interruptions to the mains power supply to the site caused by nearby roadworks, and the operating temperature of the outstation at Perkkaa was slightly high (it was a warm summer afternoon). The small squares across the traffic lanes at each outstation represent individual cameras. In the above example, the camera over the slow westbound lane at Ensonkuja is shown orange, indicating an abnormally low reading rate, caused by the camera having been knocked out of alignment. Clicking on one of the coloured outstation labels displays the log of errors for that outstation.
The PKS journey-time data are shown by courtesy of the Tiehallinto.
$Id: pks.html,v 1.11 2018/05/19 09:40:55 mkc Exp $